The Inner Source team goal is to provide tools to improve the life of a Flutter engineer, but its hard to get the attention of our users to communicate improvements to them. We currently use email newsletters, Slack announcements and documentation on this website you’re currently browsing.
We want to improve our communication with the GitHub community and that’s when we questioned “Who should we contact to speed up the knowledge share across the community?” In other words, who are the most influential people in our GitHub organisation?
Note: All the numbers in this blog post are real, but the users’ names have been randomly generated to maintain privacy.
GitHub Influencers
I extracted pull request and issue data from the Flutter-Global organisation from the last six months. Then, I collected all user-to-user interactions throughout these – more than 120,000 interactions.
The first metric I calculated was the total number of unique users a user has interacted with – Total Unique Interactions. The distribution of this metric is:
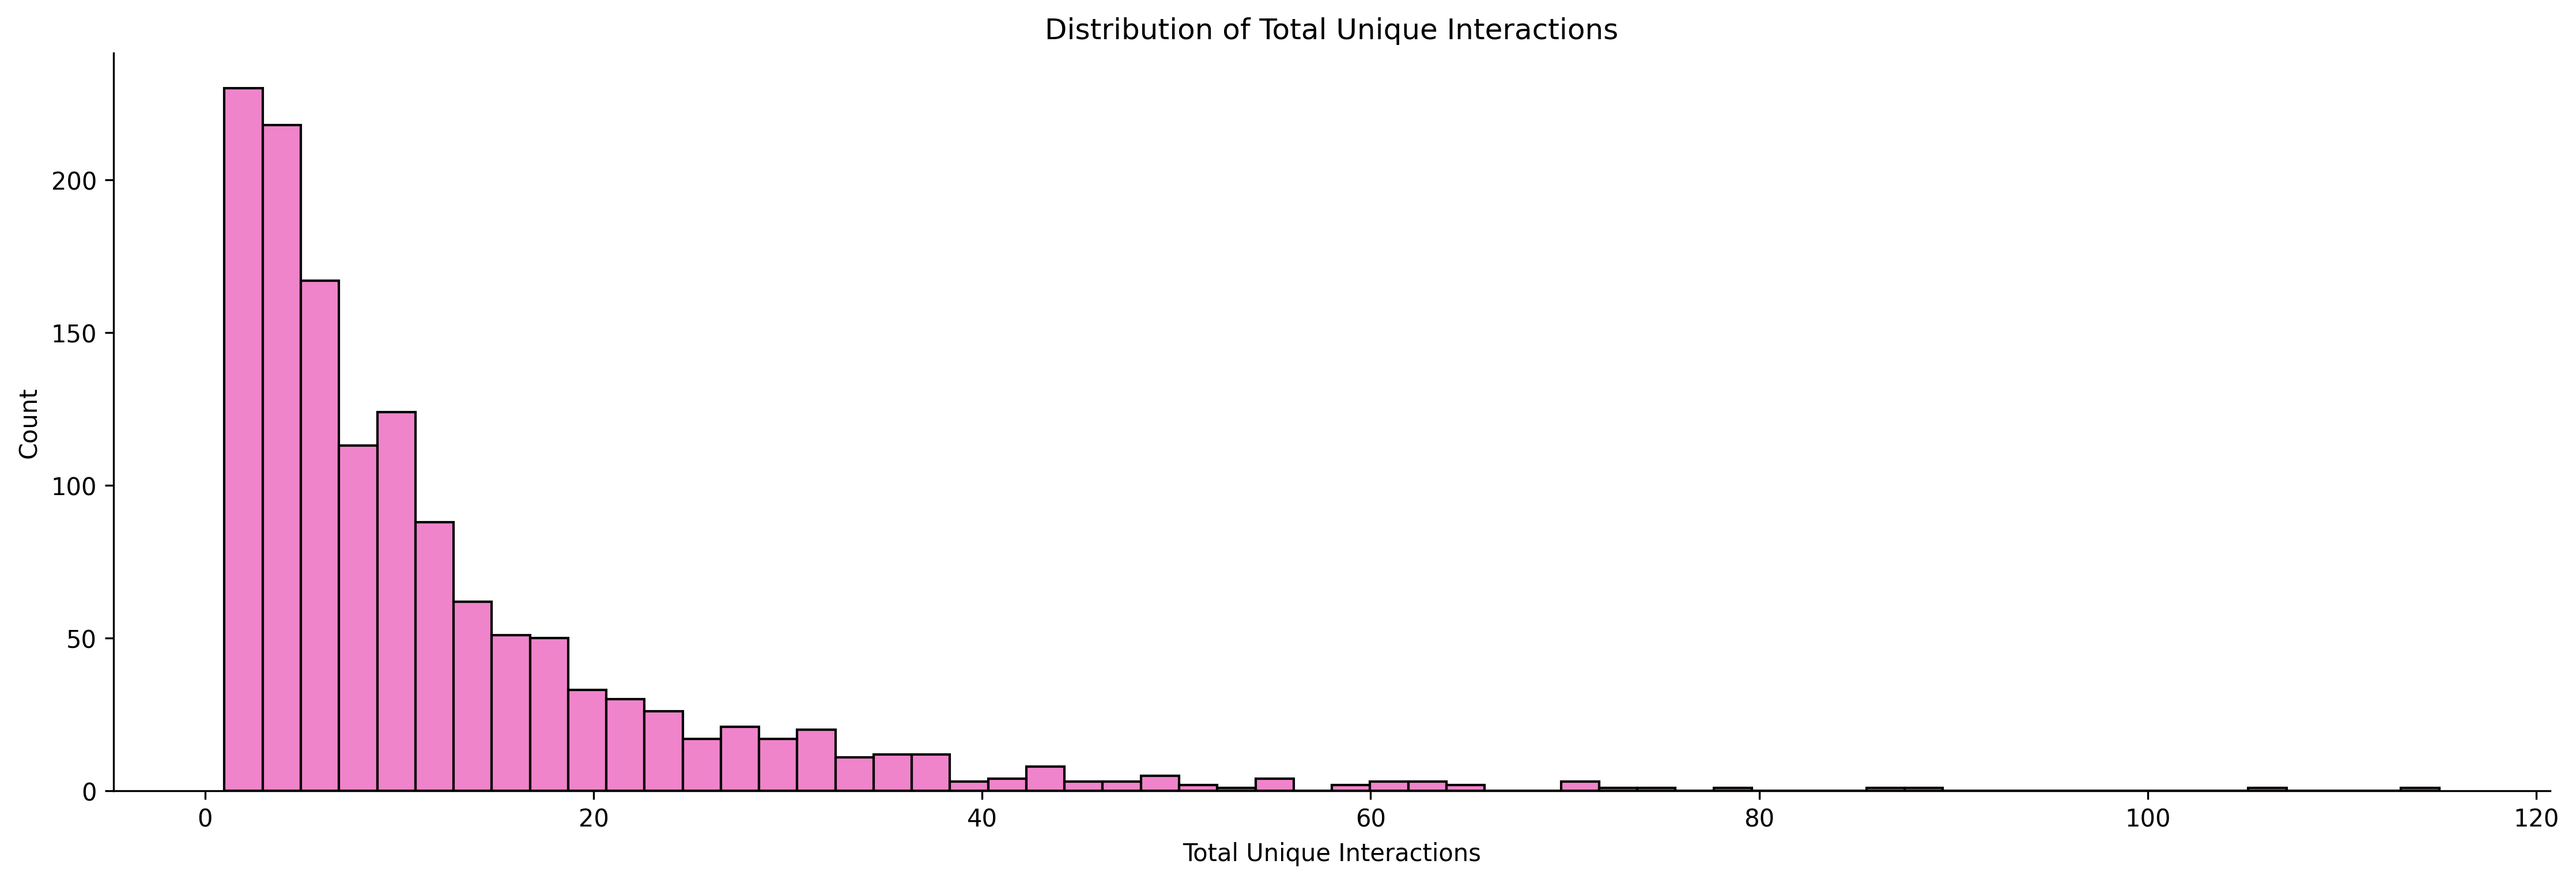
The majority of our users interact with only a few others – presumably the other members of their team. We’ll find our influencers in those smaller bars at the other end of the distribution – those interacting with many others. The users with the most unique interactions are:
| User | Total Unique Interactions |
|---|---|
| Finn Burton | 115 |
| Kiley Delgado | 108 |
| Reese Sosa | 90 |
| Anya Hayes | 89 |
| Adrienne Pace | 80 |
| Mariyah Peterson | 76 |
| Xavier Krueger | 73 |
| Adeline Shah | 73 |
| Ruth Carlson | 71 |
| Alexandra Khan | 71 |
Interesting to see that 4 out of the top 10 users are members of our team – responsible for support and regular codebase governor PR approvals. We interact with more users than the average user, but most of those interactions are superficial and done in a support capacity.
This shows the need to take into account how strong these interactions are. Is our team a good example of influential users or are our interactions mostly superficial?
Measuring the Strength of Interactions
As we’ve seen above, 4 out of the top 10 users with the most unique interactions are part of our team. In particular, the user with the most unique interactions is Finn Burton. Finn does a bunch of support work for the team and is regularly interacting with a large group of people reviewing pull requests and creating some for others to review.
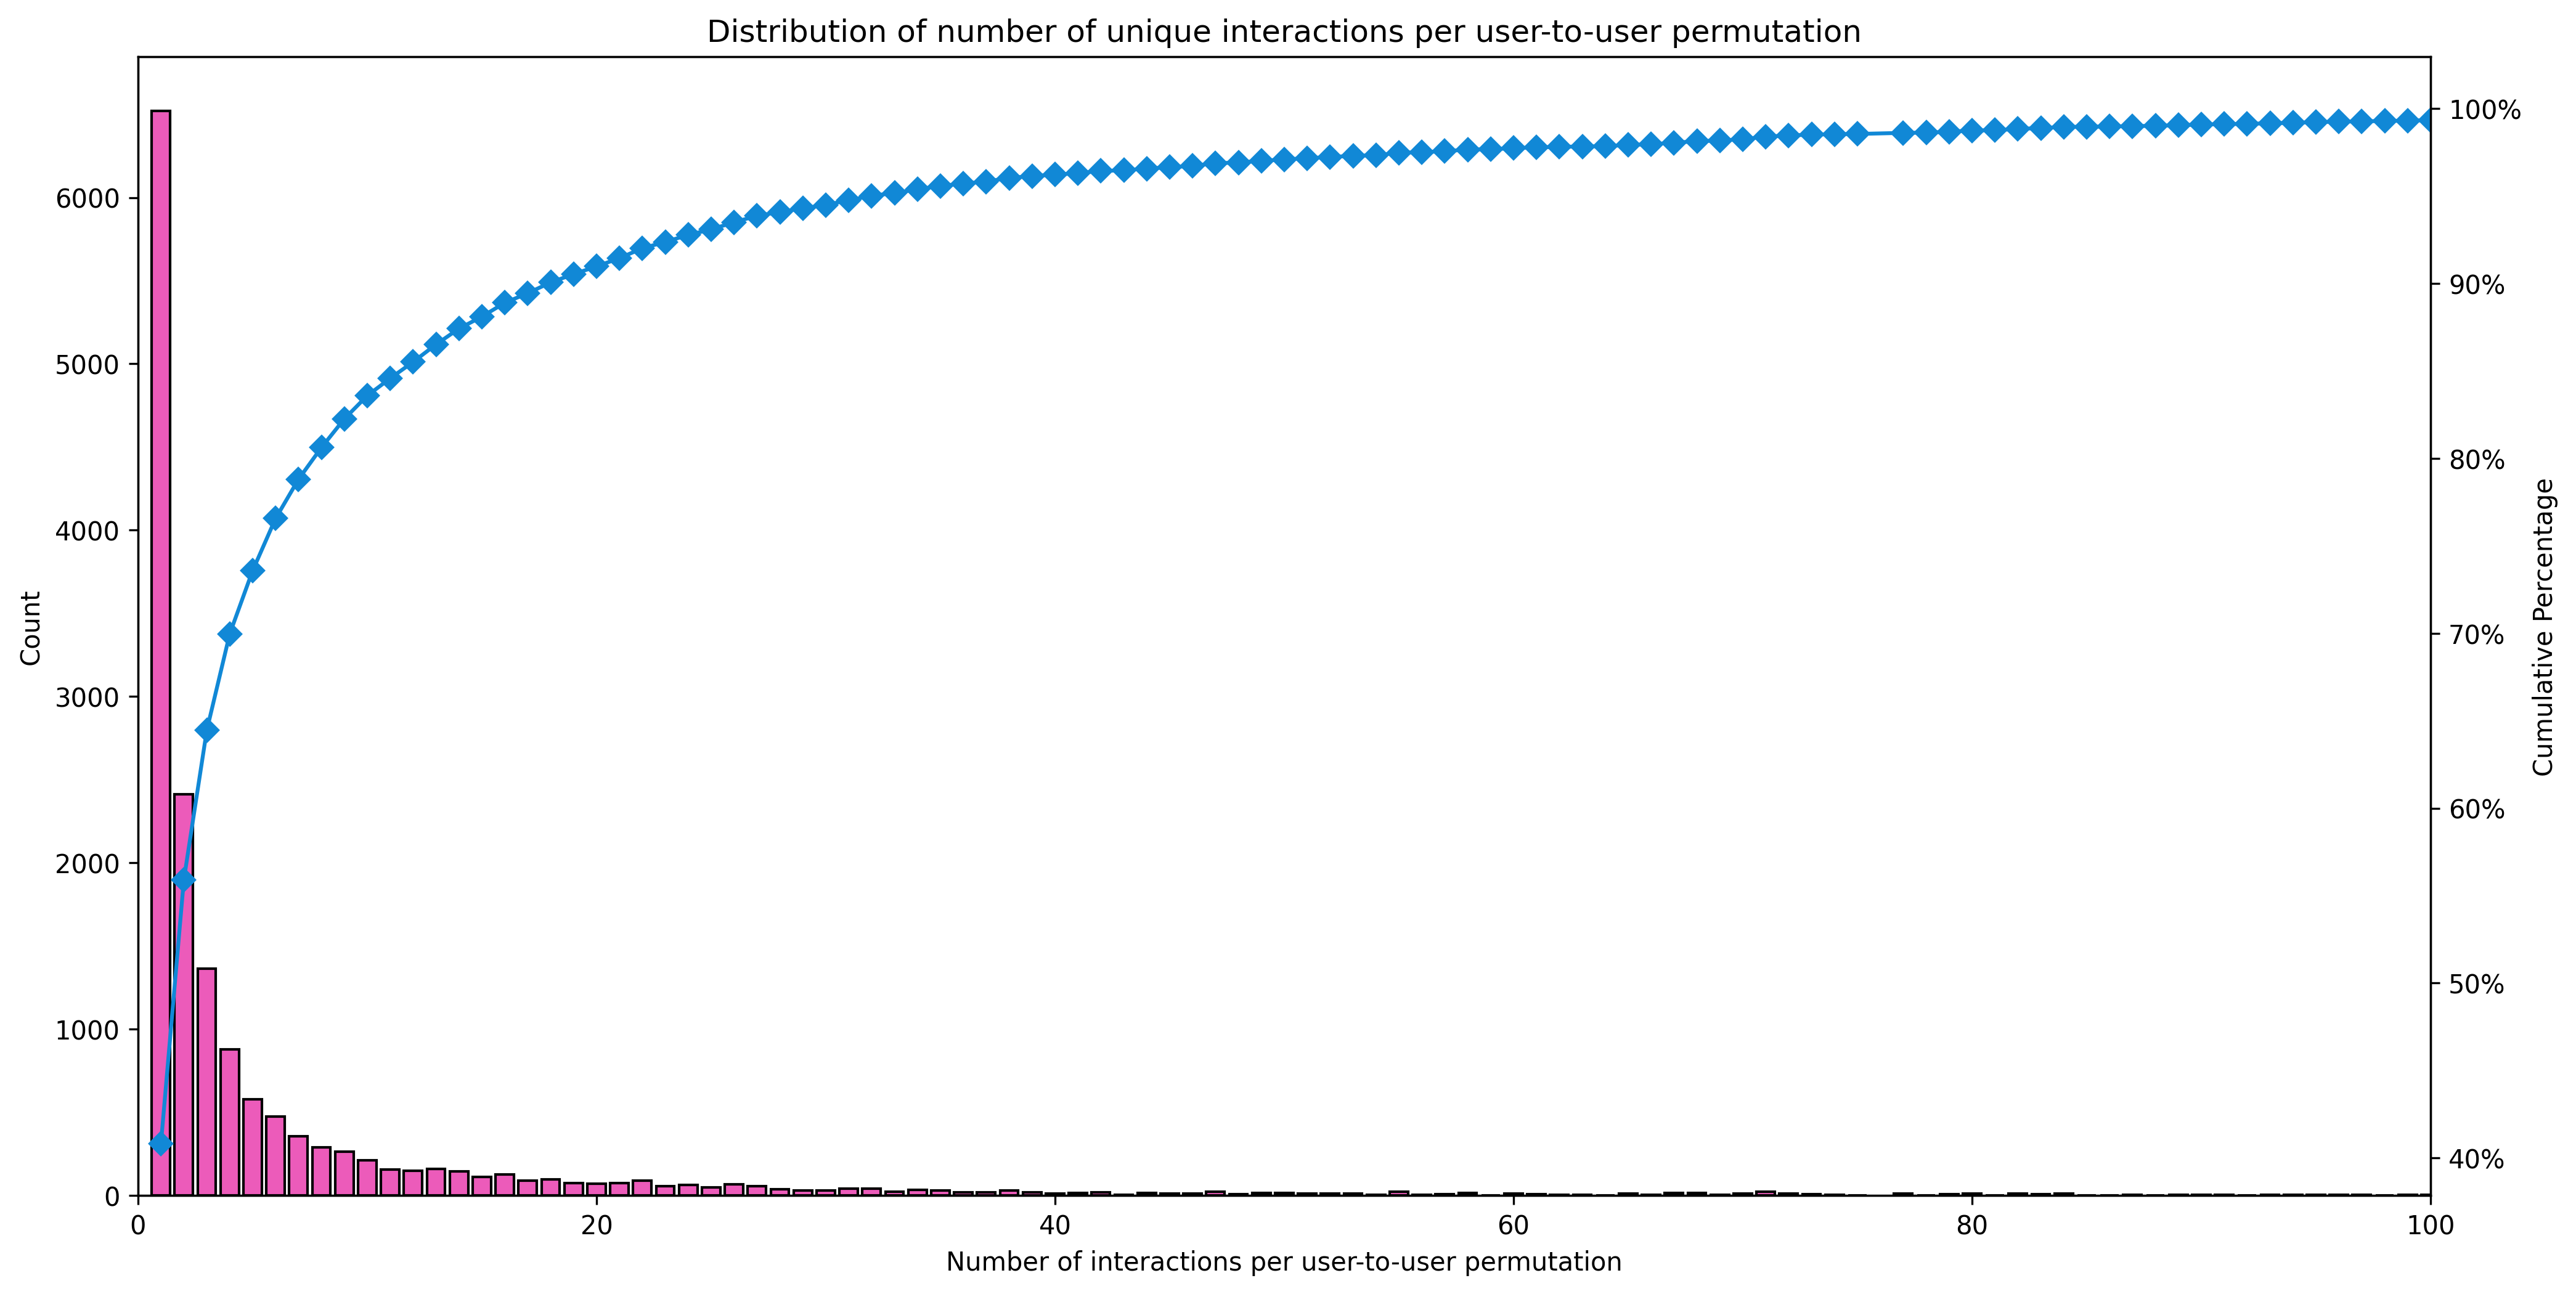
However, these interactions are one off support interactions and Finn won’t interact with the same user regularly through support work. How can we measure the strength of these interactions? For the sake of this blog post, I kept it simple and calculated how many times a user has interacted with the other user.
The distribution below shows how the majority of interactions aren’t regular: over 50% of the interactions between users happen only a few times within our 6 months period. Some interactions are incredibly strong, with a few users interacting with each other more than 300 times. There are 256 working days in 6 months, so this is more than one interaction together on GitHub per day.
Note: The original chart goes up to 300 interactions in the x-axis, but for the sake of readability I cut it off at 100 interactions.
I followed by categorising these interactions into three categories: Weak, Moderate, and Strong. The table below shows the criteria used to categorise these interactions.
| Metric | Description |
|---|---|
| Weak Relationship Count | Number of unique users a user has interacted with less than once every two weeks |
| Moderate Relationship Count | Number of unique users a user has interacted with between every 1-2 weeks |
| Strong Relationship Count | Number of unique users a user has interacted with at least once per week |
Note: I defined these thresholds based purely on common sense. Perhaps there is a more scientific way, but this is simple at least.
If we filter interactions and only keep the ones considered strong, we get a very different top 10 user table:
| User | Strong Unique Interactions |
|---|---|
| Bryanna Robinson | 14 |
| Lesly Chase | 12 |
| Ethen Elliott | 11 |
| Justice Matthews | 11 |
| Adrienne Pace | 11 |
| Kolby Maynard | 10 |
| Carmelo Gilbert | 10 |
| Angelo Meadows | 9 |
| Raymond Rosario | 9 |
| Karissa Frost | 9 |
Only one user is present in both the Total Unique Interactions and the Strong Unique Interactions tables – Adrienne Pance. This is perhaps a better view of our influencers, those users who regularly interact with a large audience.
In fact, even if we look at the top 10 users with the most moderate + strong unique interactions, the users are still different from the ones present in the Total Unique Interactions table.
| User | Moderate + Strong Unique Interactions |
|---|---|
| Lexie Woodard | 17 |
| Karissa Frost | 17 |
| Ethen Elliott | 17 |
| Bryanna Robinson | 16 |
| Lesly Chase | 15 |
| Shayla Cline | 15 |
| Anya Hayes | 14 |
| Adeline Shah | 14 |
| Kayleigh Logan | 14 |
| Kolby Maynard | 14 |
This further emphasises the need to take into account the strength of the interactions when trying to find the most influential users in an organisation.
Conclusion
This blog post showed that:
- Using a simple count of unique interactions over-emphasises support or platform engineers. These users interact with a lot of GitHub users but superficially, for example once or twice only to help them resolve a problem.
- Categorising interactions into weak, moderate, and strong corrects this bias, and allows us to see those users who are regularly interacting with a large group of users. We see these users as a useful group to provide more direct communication or GitHub training for.
- We’ve used some common sense to define thresholds between these relationship “strengths”, but think there’s further work to refine these and/or do further social graph analysis. But our results are “good enough” to try some activities with the defined influencer group.
by: Tiago Almeida, Arun Dani
in:
tags: Users
category: Insight