An important team measurement is cycle time – the time it takes for the development of a new feature from idea to release. Part of the cycle time is pull request lead time: the length of time from when a pull request is created to when it is merged. This article examines the relationship between pull request lead time and five different factors: cross-divisional contributions, number of approvals required, number of maintainers, pull request size and repository main language.
Understanding the dataset
I extracted pull request data from the Flutter-Global organisation that have been merged in the last six months – 20000 pull requests.
For this blog post, I will only be using pull requests that have been merged and also be using a selection of properties from multiple other datasets, which are explained in the table below.
| Dataset | Property | Description |
|---|---|---|
| Repositories | Primary Language | Primary language used in the repository |
| Repositories | Number of required approvals | Number of required approvals set in the branch protections for the pull request’s base branch |
| Repositories | Number of maintainers | Number of maintainers of the repository |
| Pull requests | Changes | Sum of additions and deletions |
| Pull requests | Lead time | Time, in hours, between the pull request’s creation and its merge |
| Pull requests | Is cross divisional | Whether at least two users from different divisions created and/or reviewed the pull request |
What variables influence pull request lead time?
In this blog post, I will take a look at the relationship between five different factors and pull request lead time:
- Cross-divisional/divisional contributions
- Number of approvals required
- Number of maintainers
- Pull request size, based on the number of changes
- Repository main language
Note that must plots presented below are box plots. Box plots are great to visualize quartiles and the data spread, including outliers. The middle line of the box represents the 2nd quartile (also known as 50% percentile, or median). The left and right borders of the box represent the 1st (25% percentile) and 3rd (75% percentile) quartiles, respectively. The whiskers outside the box usually stretch from the lowest value to the highest, giving us an idea of the spread of the data. Dots on the extreme sides of the whiskers represent outliers. For a more detailed explanation on box plots, you can visit Quartiles & Quantiles.
Additionally, the lead time axis in the chart will be presented with a log10 transformation.
Cross-divisional vs divisional pull requests
Let’s take a look at the relationship between cross-divisional/divisional pull request and lead time:
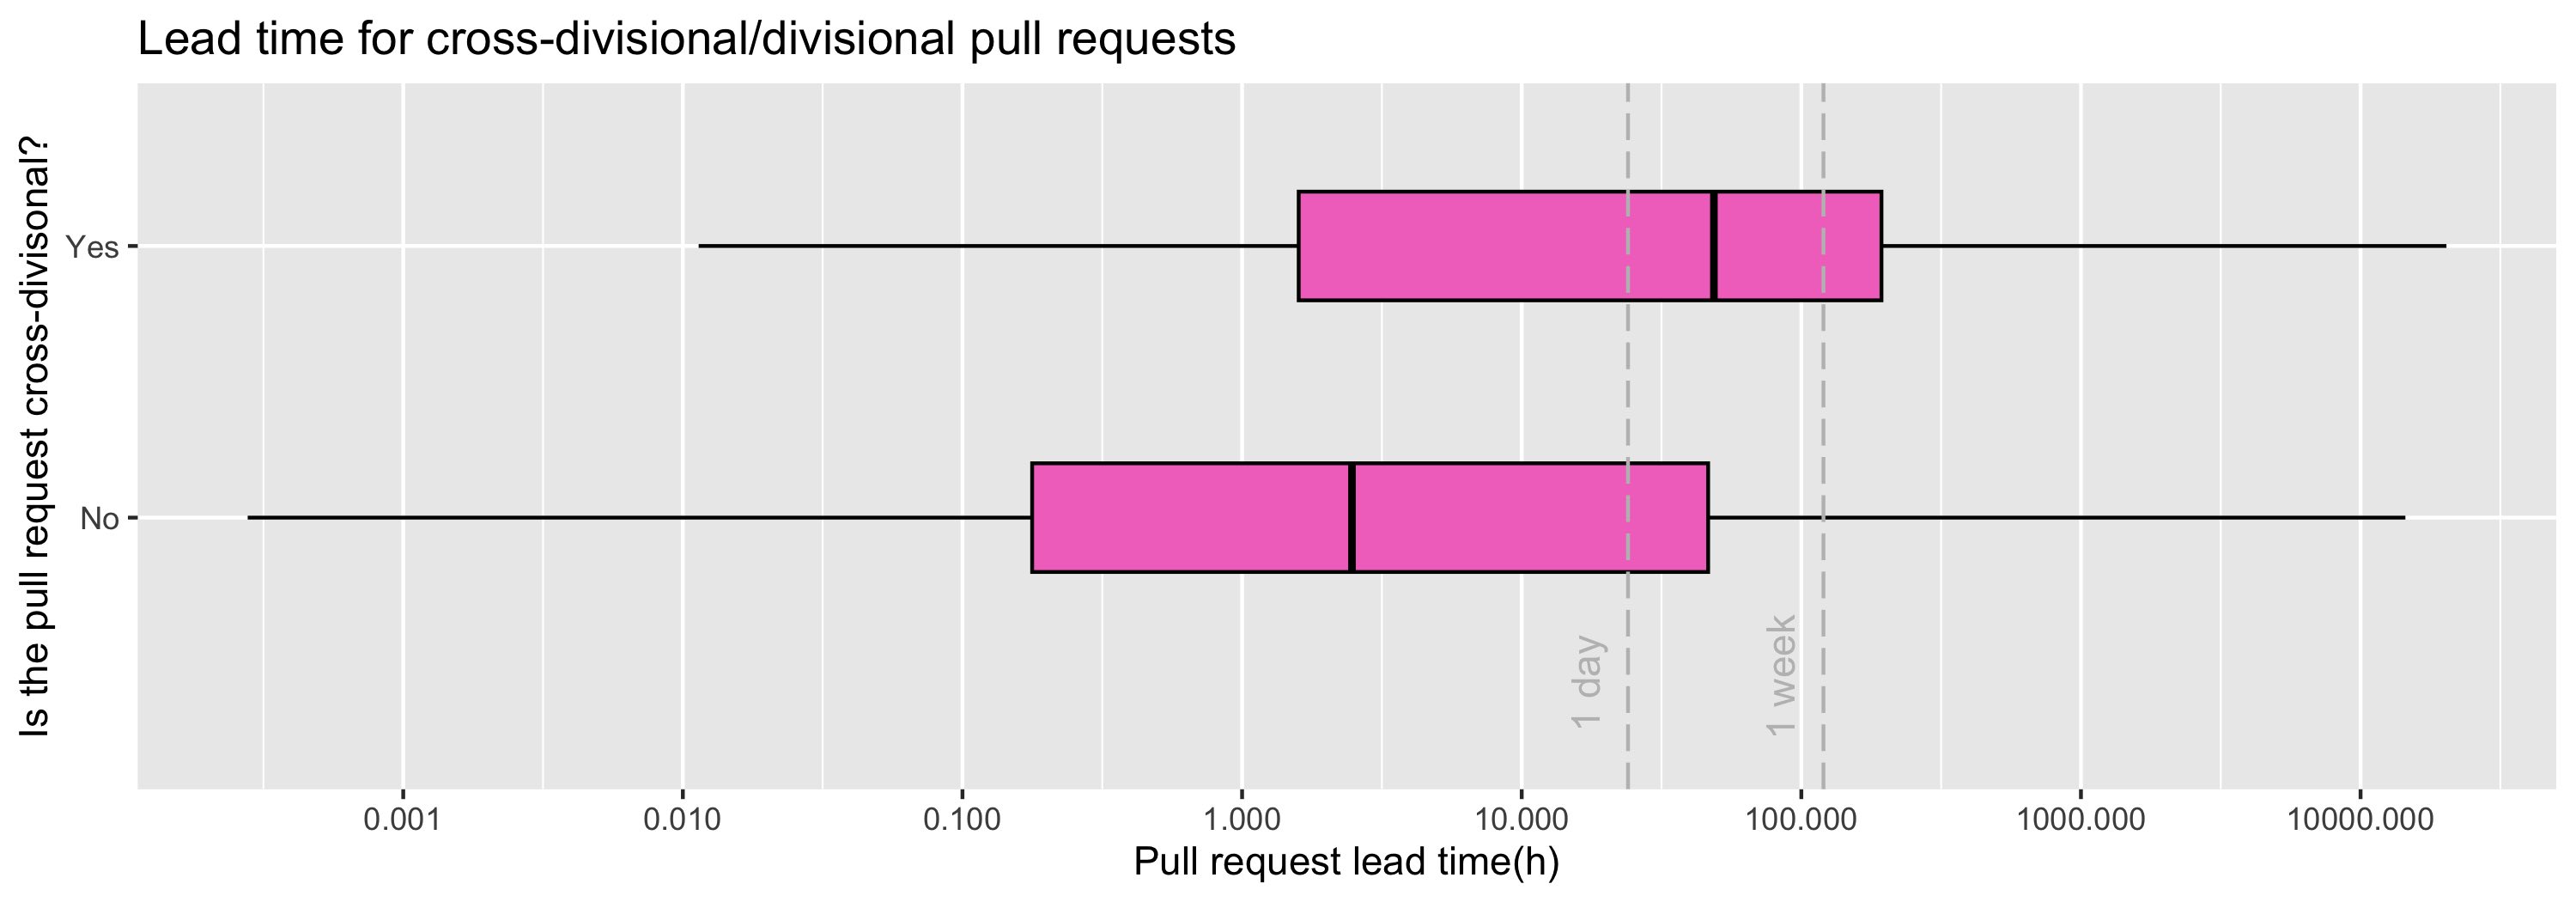
Since the lead time is presented in a log10 scale, the difference in the median (50th percentile) is quite significant – around 2 hours for divisional pull requests and around 48 hours for cross-divisional pull requests. This shows a clear relationship between cross-division interaction and lead time. However, further analysis is needed to understand if the lead time for cross-divisional pull requests is not changing due to other reasons, e.g. number of approvals required.
Number of approvals required
Let’s take a look at the relationship between number of approvals required and lead time:
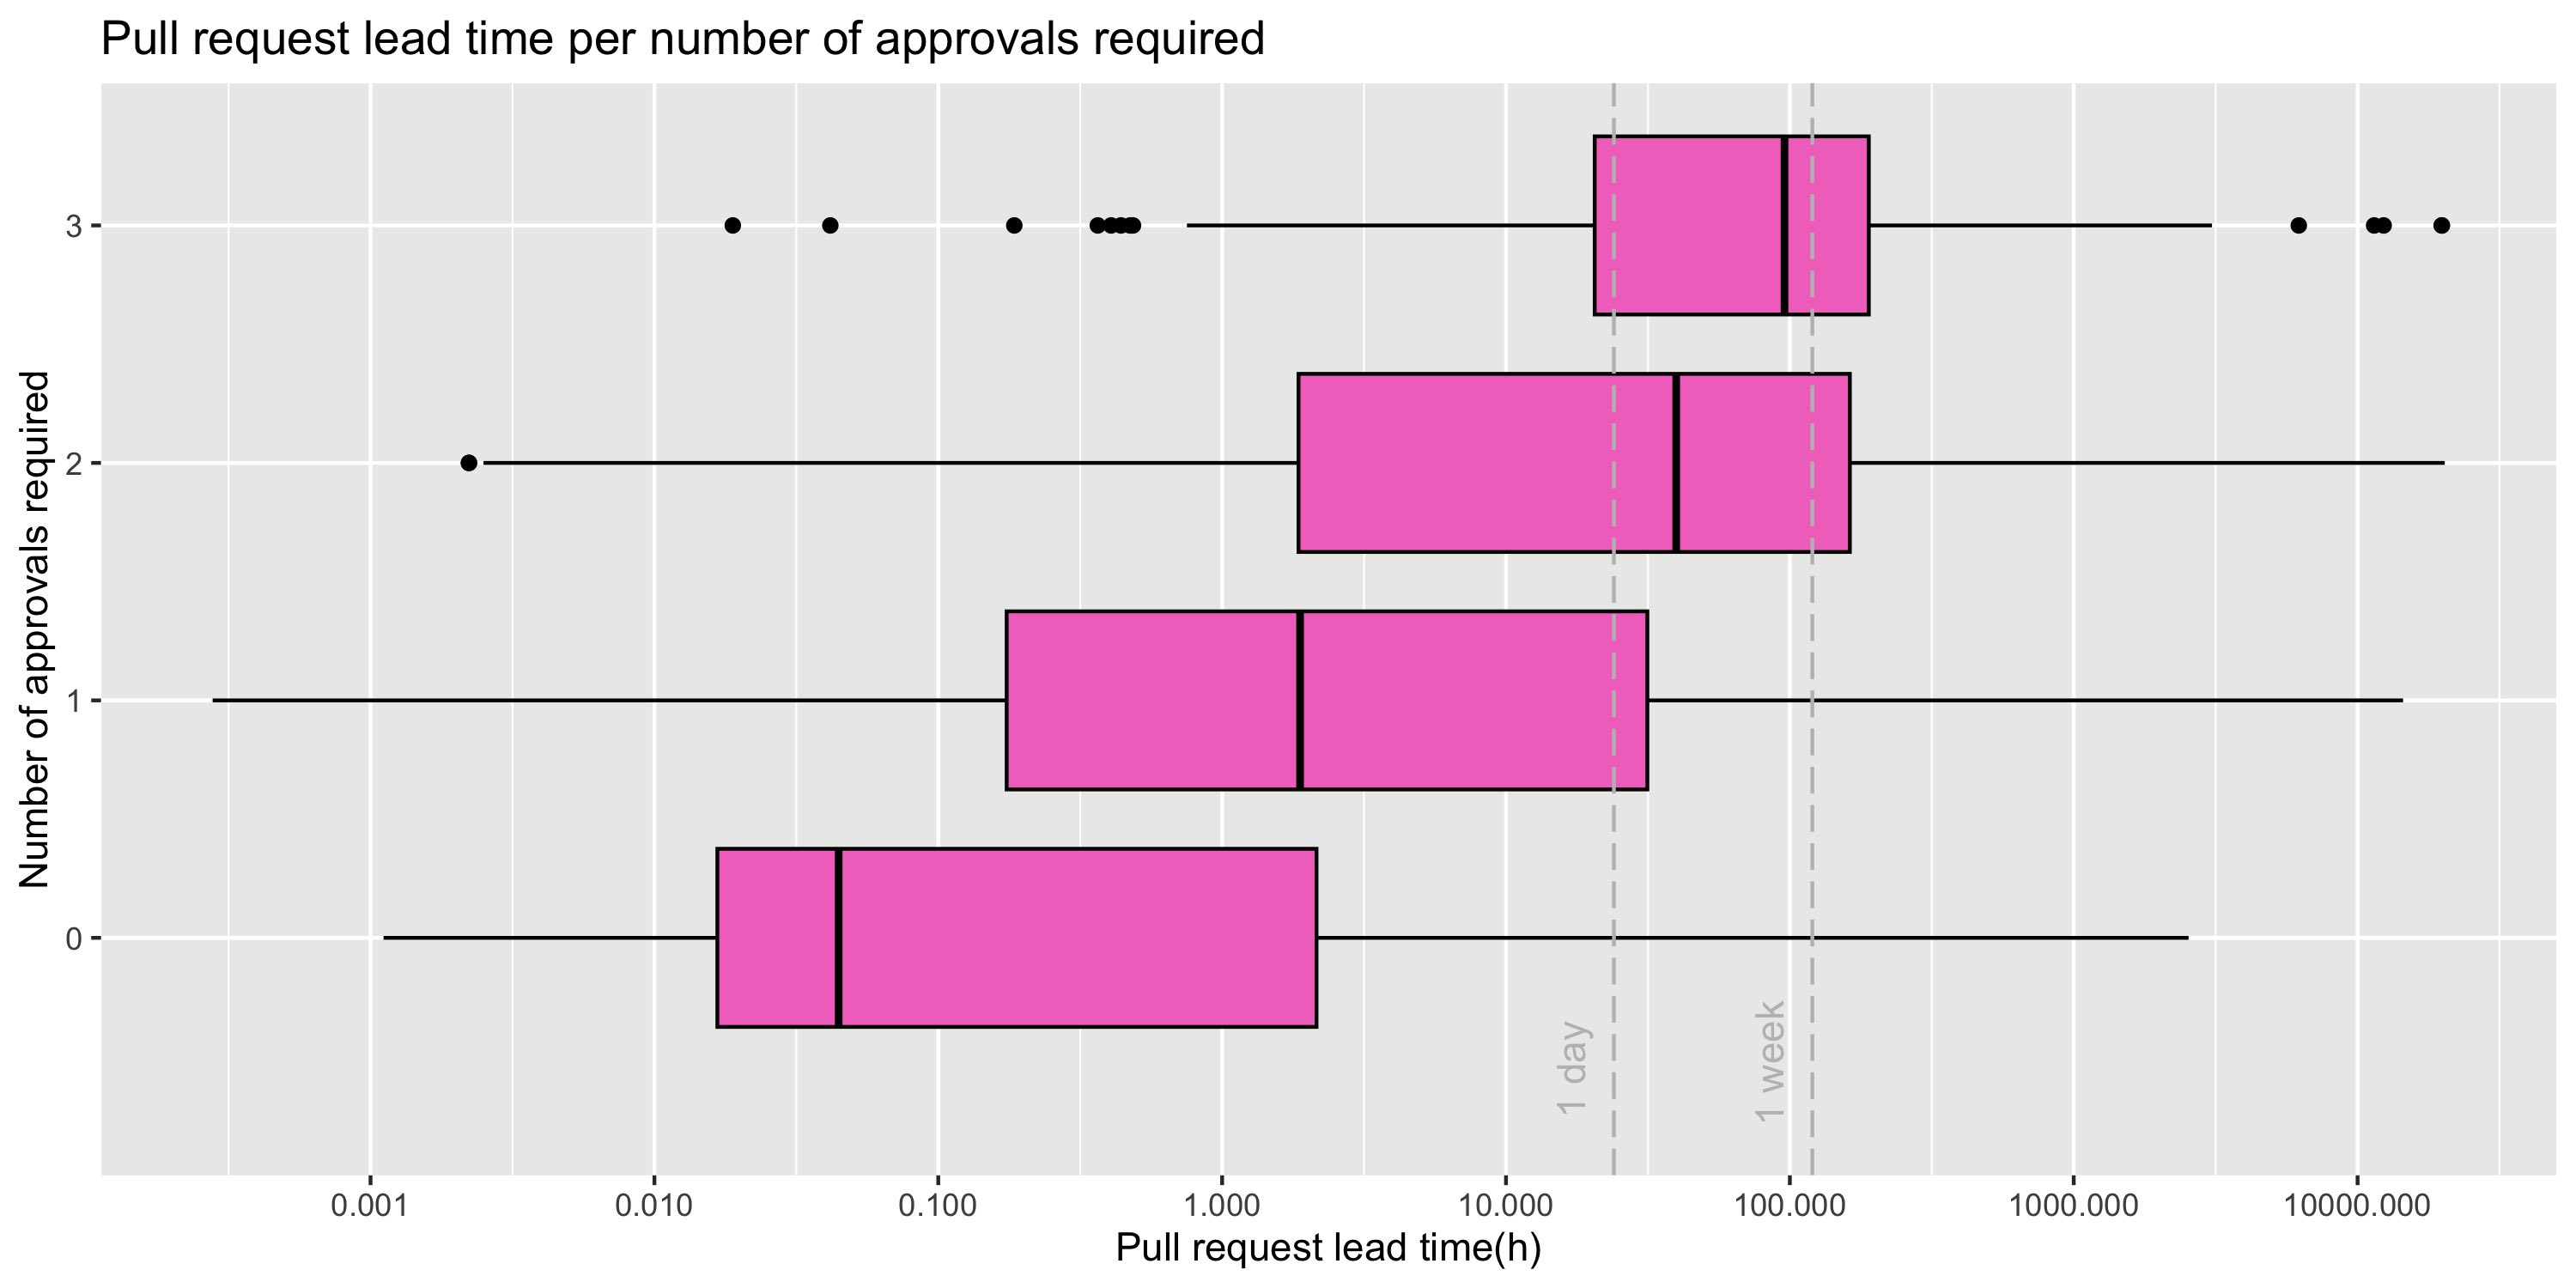
It’s clear to see that as the number of approvals required increases, the pull request lead time also increases, which is the expected result. It is interesting to see that the median changes significantly between 0 approvals required and 1 approval required, demonstrating that the introduction of required approvals impacts lead time significantly.
Number of maintainers
Let’s take a look at the relationship between number of maintainers and lead time:
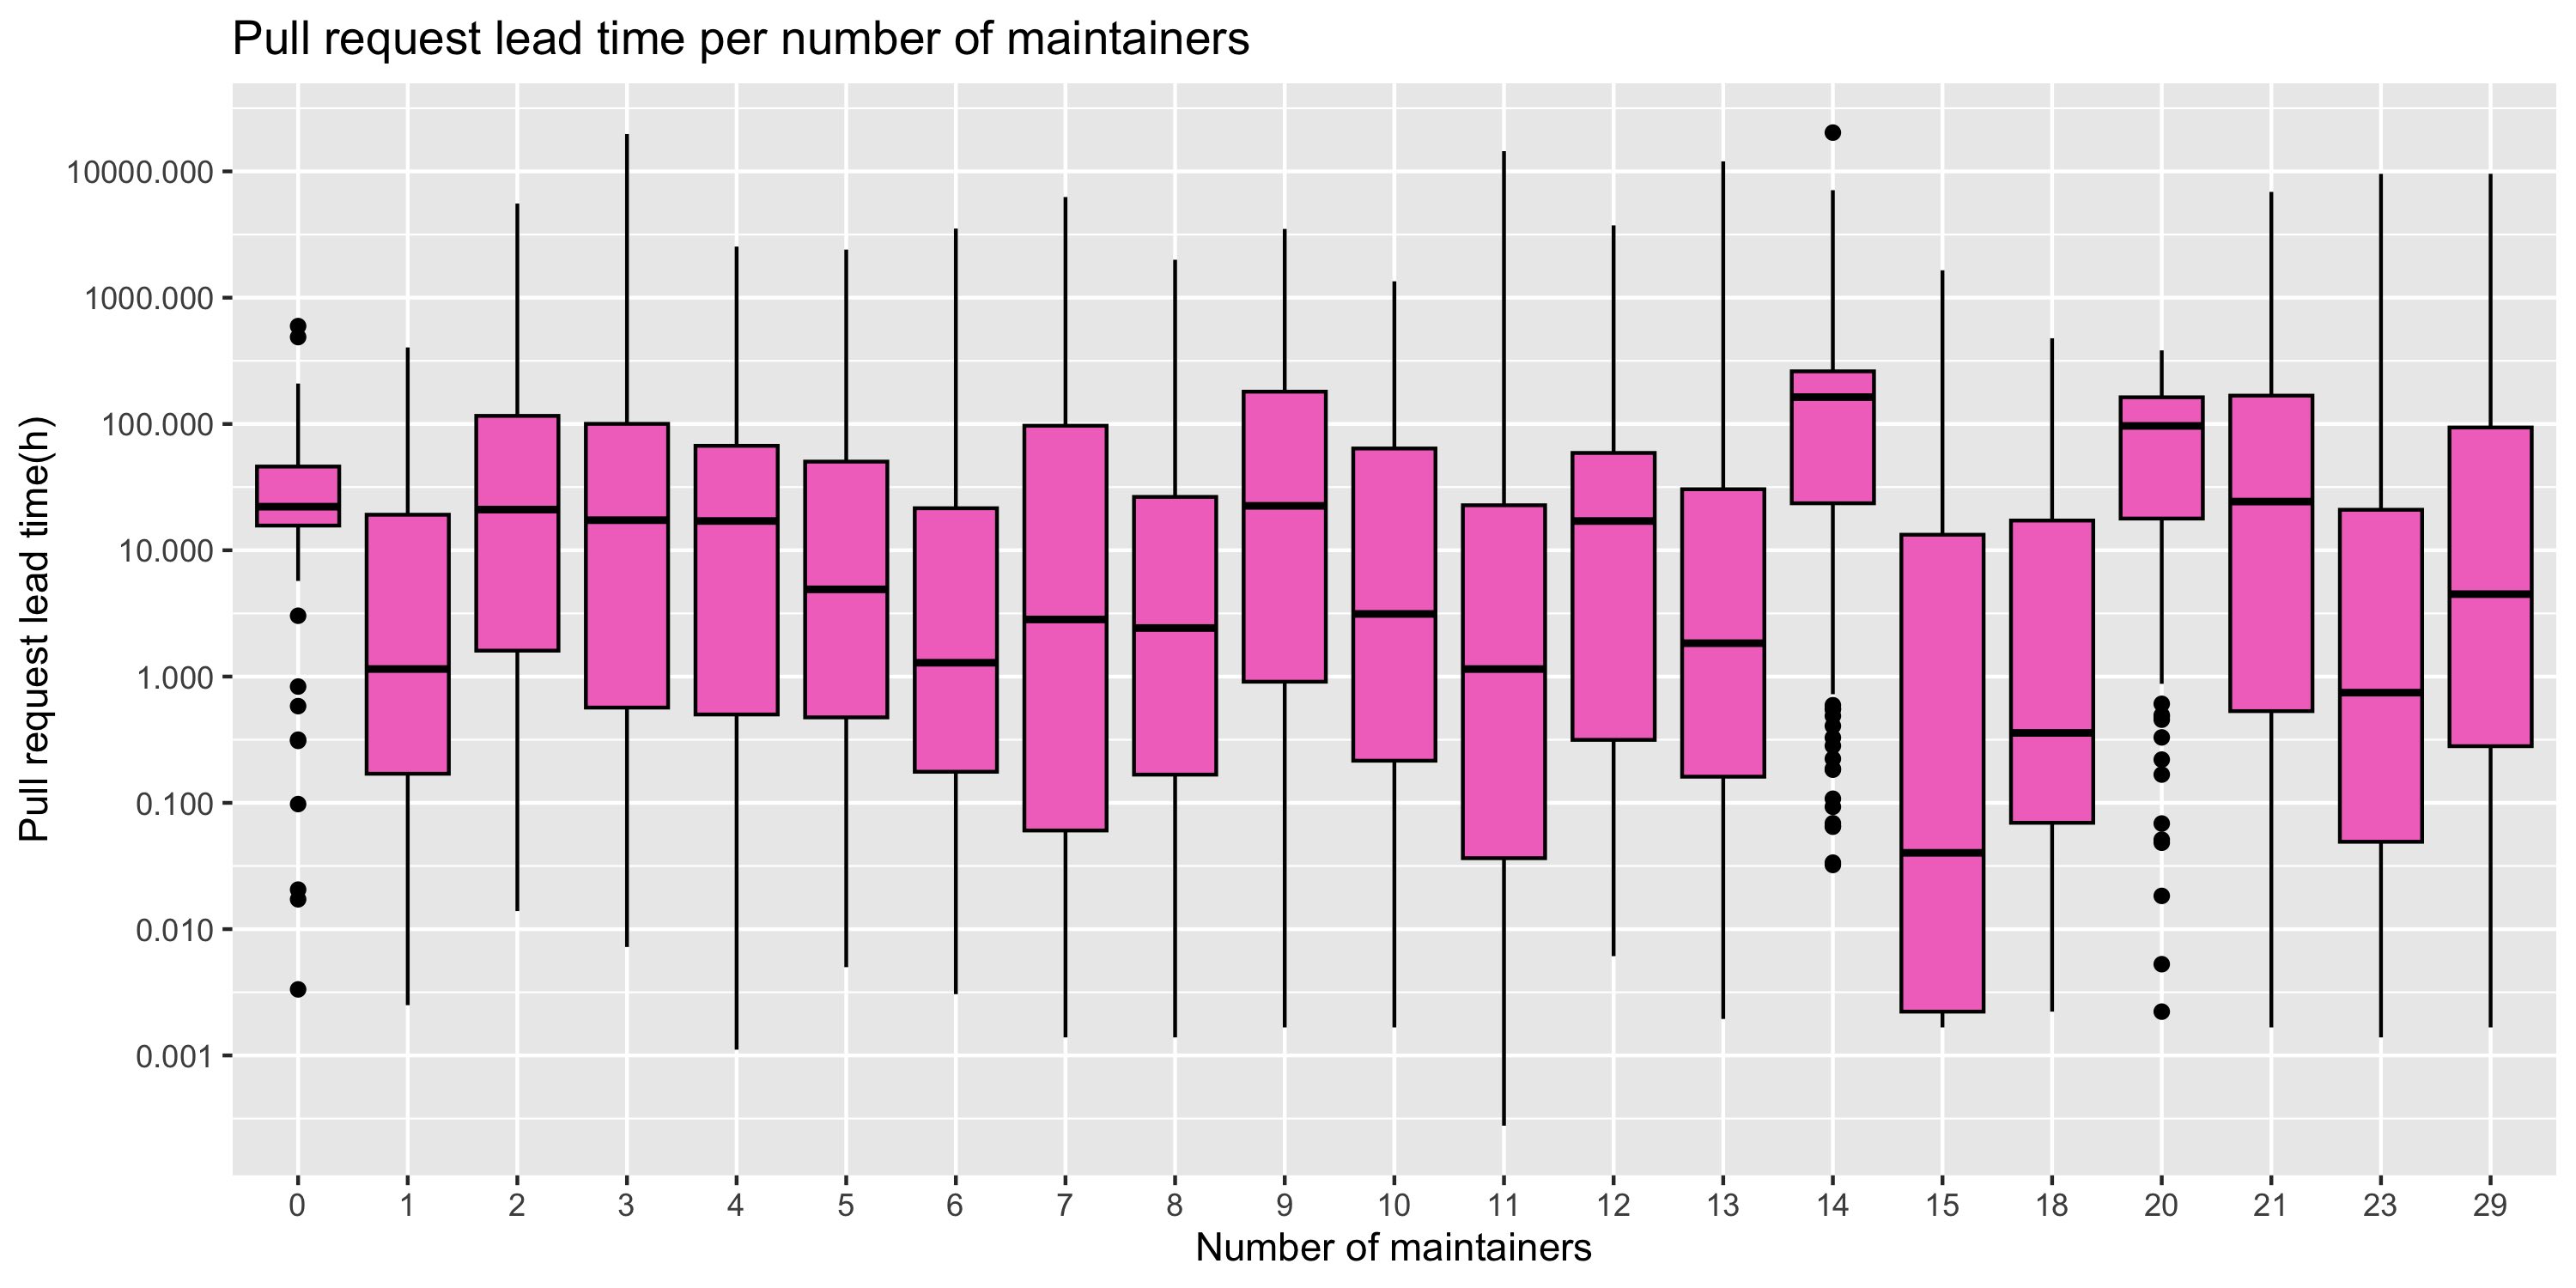
There is no apparent correlation between these two variables. However, this chart does not take into account divisional distribution inside the maintainers groups. Thus, although total number of maintainers, independently of their division, does not seem to impact lead time on its own, it might be interesting to analyse this same correlation by divisional distribution in the future.
Pull request size
Let’s take a look at the relationship between pull request size and lead time:
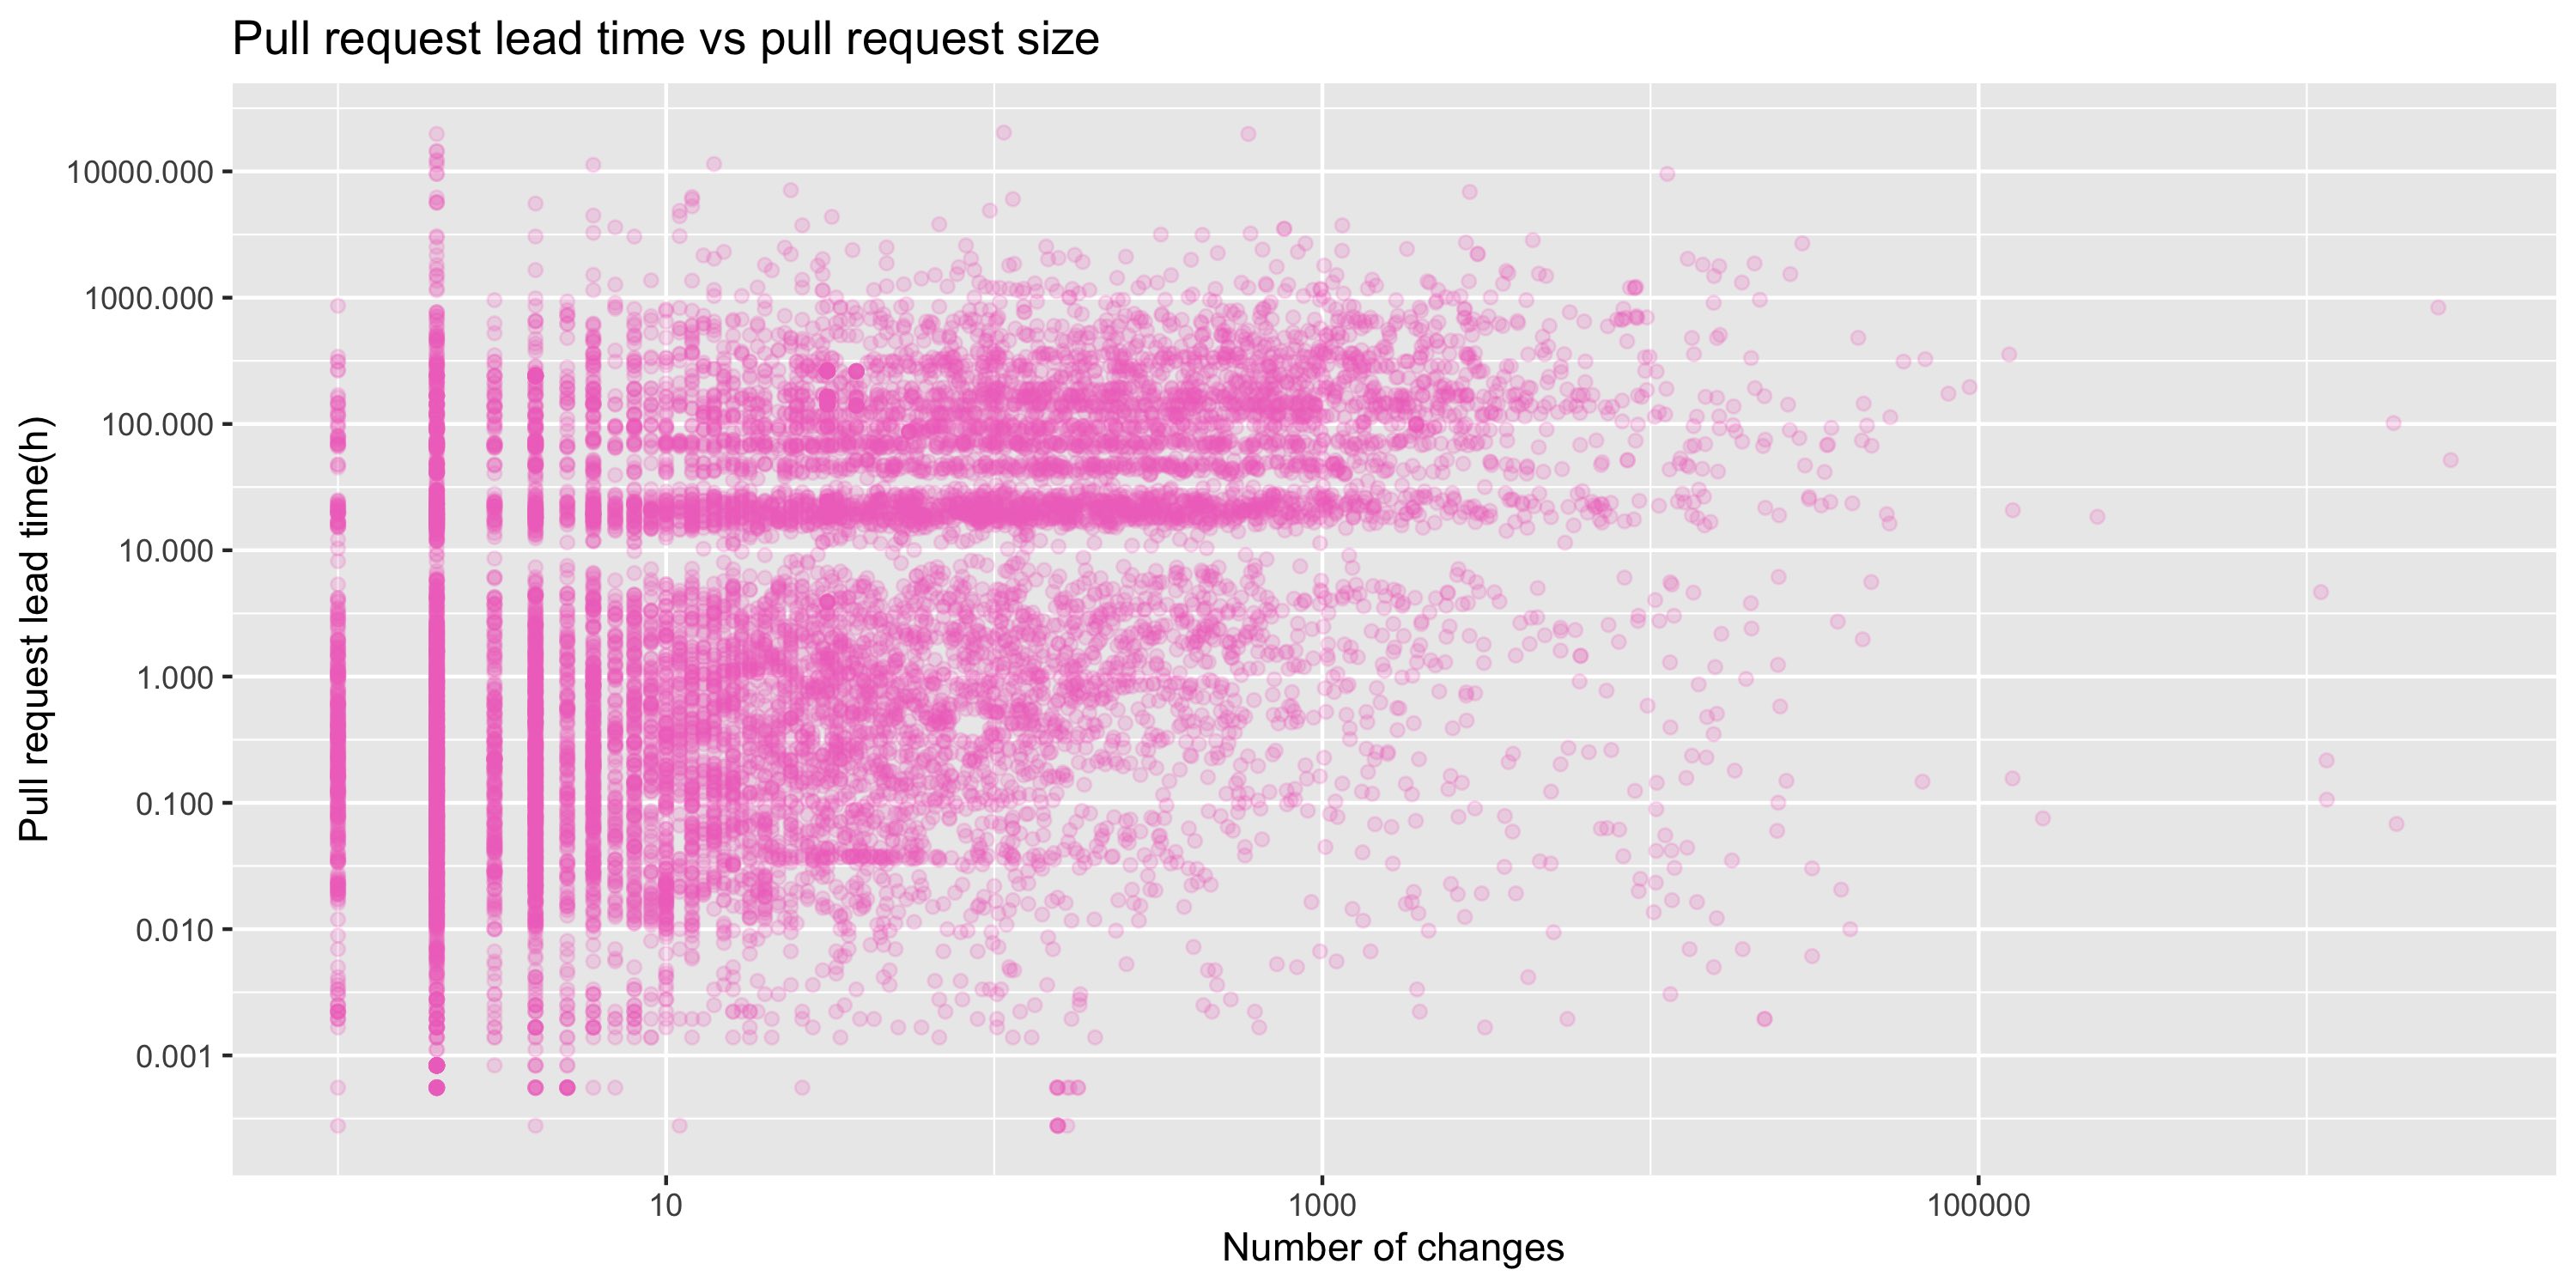
Again, there is no apparent correlation between these two variables. However, it is also important to note that in Flutter-Global, we have many different types of repositories with many different purposes. One hypothesis might be that big pull requests with relatively short lead times are related to documentation repositories. Thus, although pull request size on its own does not seem to influence lead time, it might be interesting to dive deeper into this variable in the future and analyse the same correlation for application or configuration repositories only.
Repository main language
And finally, let’s take a look at the relationship between repository primary language and lead time:
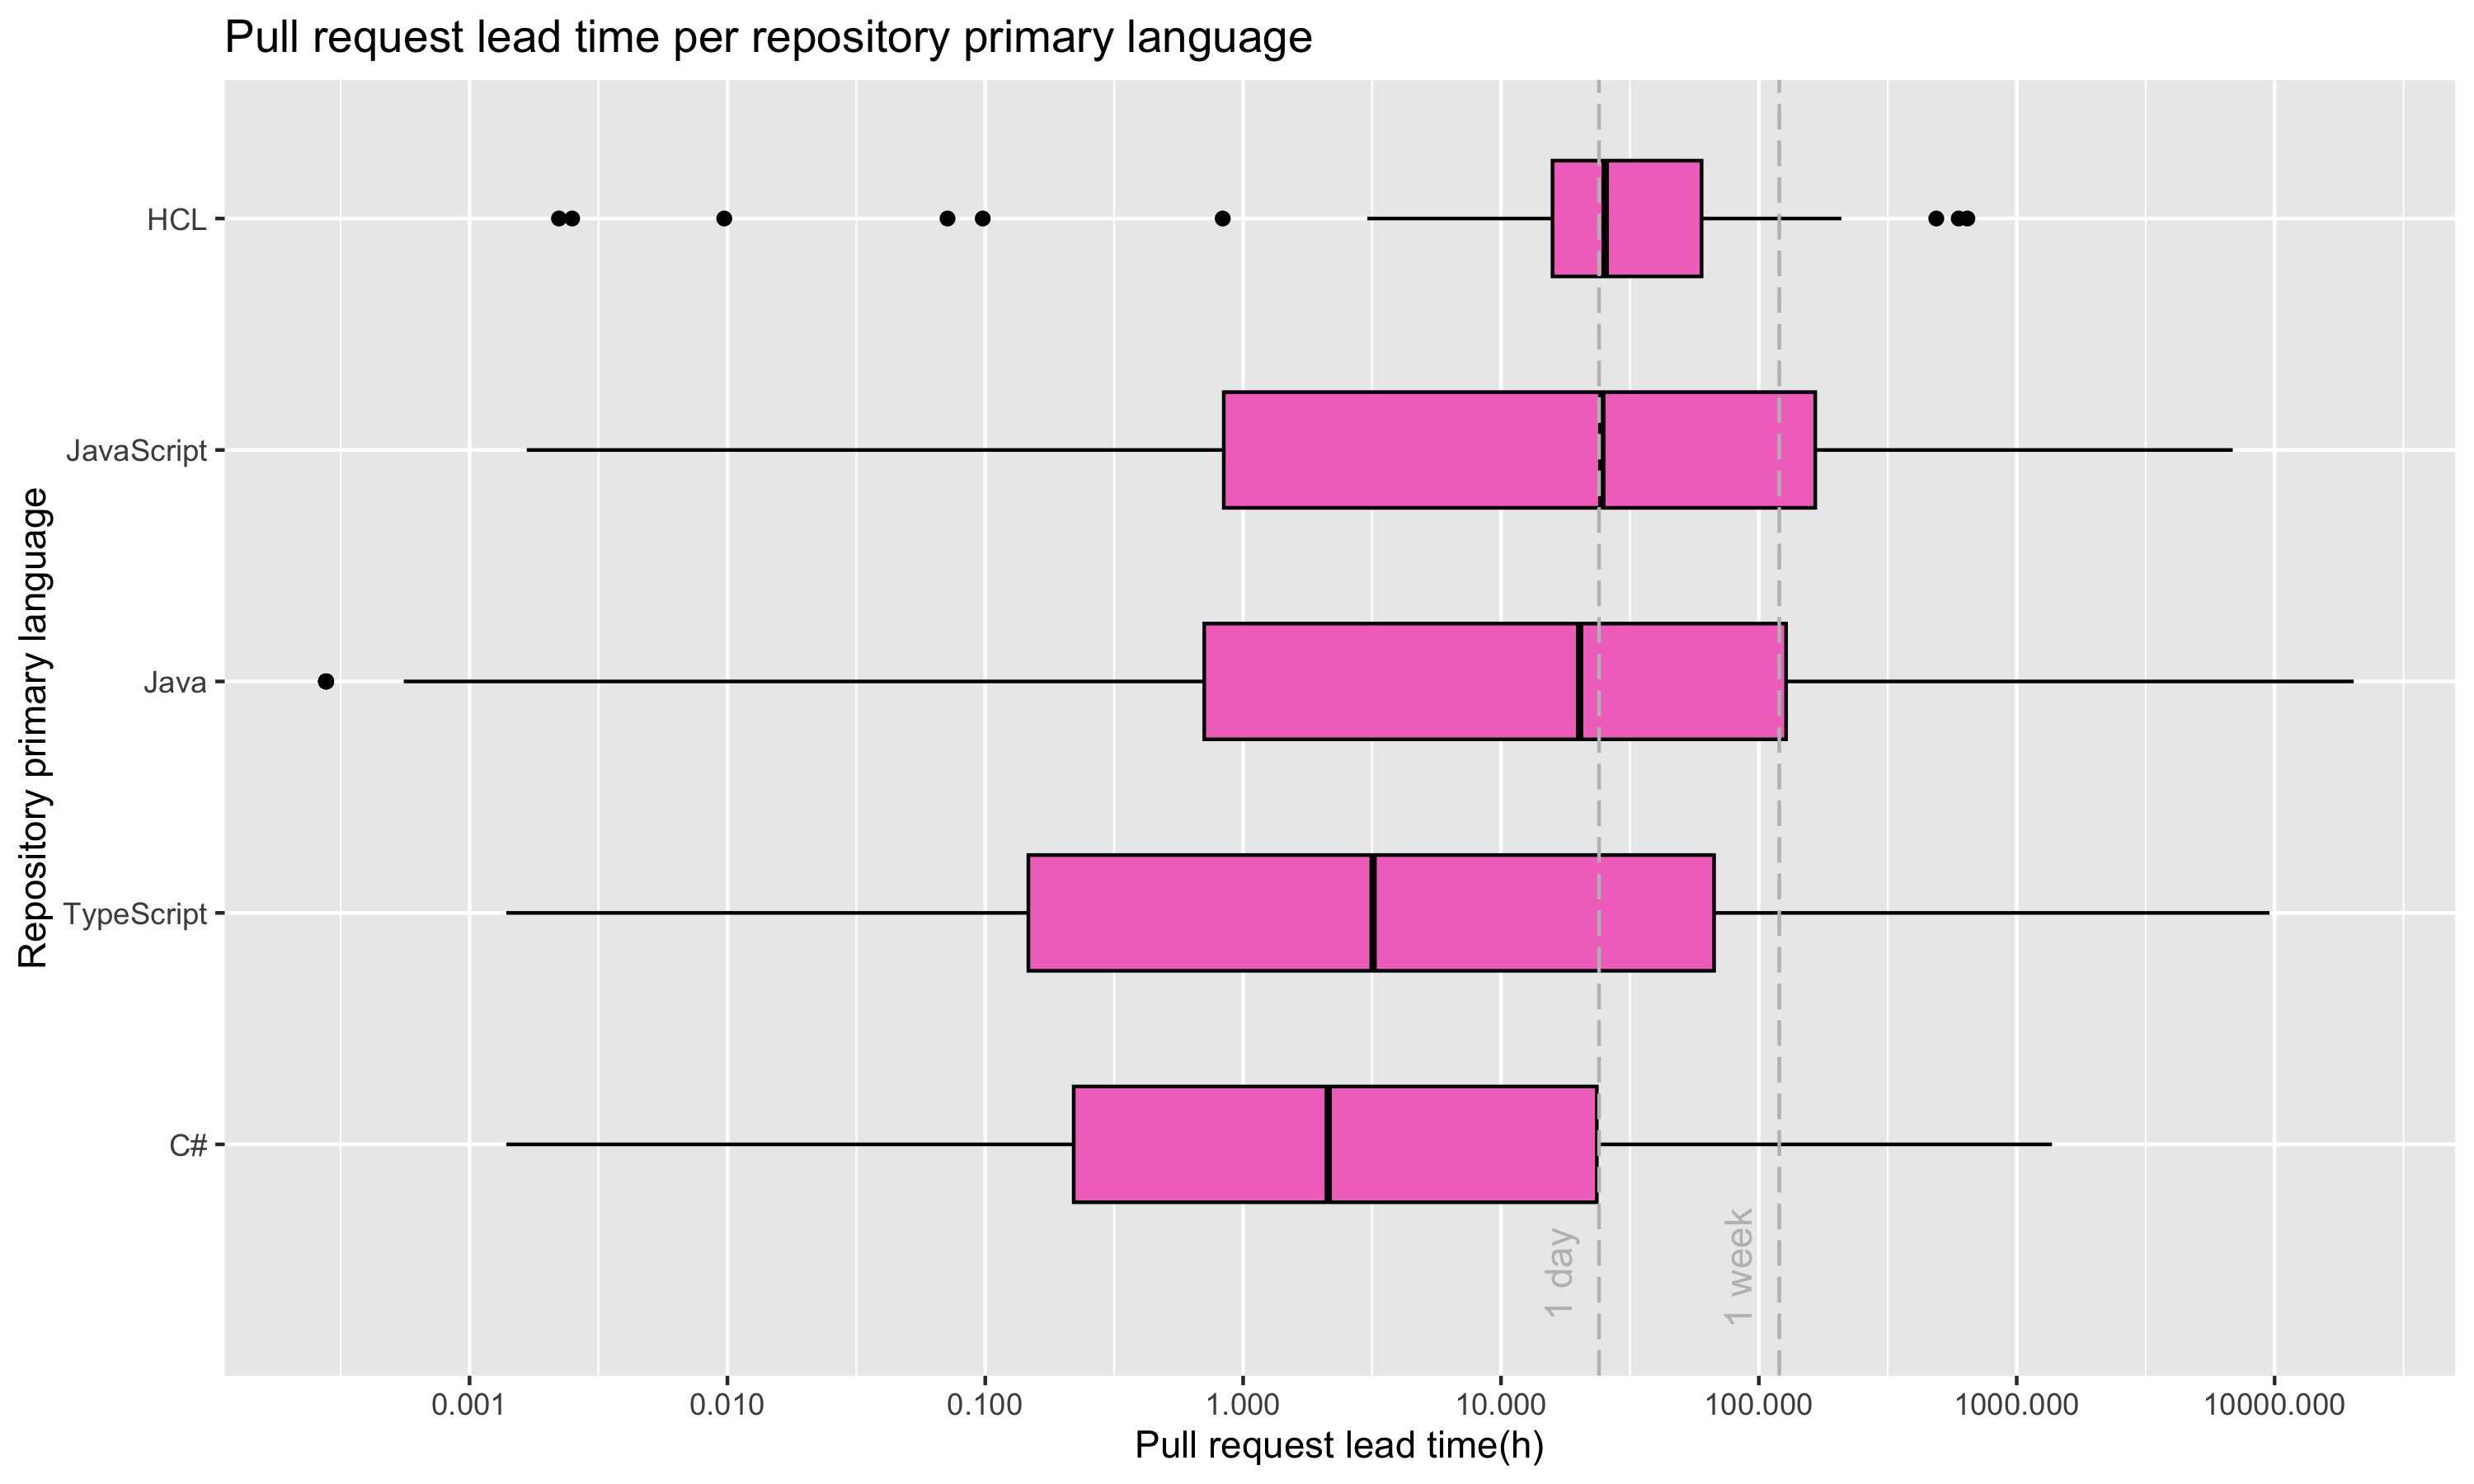
I only looked at the top five primary languages based on number of repositories and was not able to draw any meaningful conclusions from this chart regarding the relationship between repository language and lead time.
However, we can see that the only configuration type language we have in this chart is HCL and, out of all the languages, HCL is the one that presents a more consistent performance regarding pull request lead time (interquartile range is smaller). We can also see that JavaScript and Java repositories seem to be slower than TypeScript and C# repositories. It is not possible to assume the reason behind this change in lead time is due to the language, since it might be related to other factors, e.g. Java might be a more widely used language for cross-divisional pull requests, while C# might be a more widely used language for divisional pull requests.
Cross-divisional vs number of approvals required
Having noticed that both number of approvals required and whether a pull request is cross-divisional or not are variables that influence lead time, it is important to understand if there is a relationship between the two.
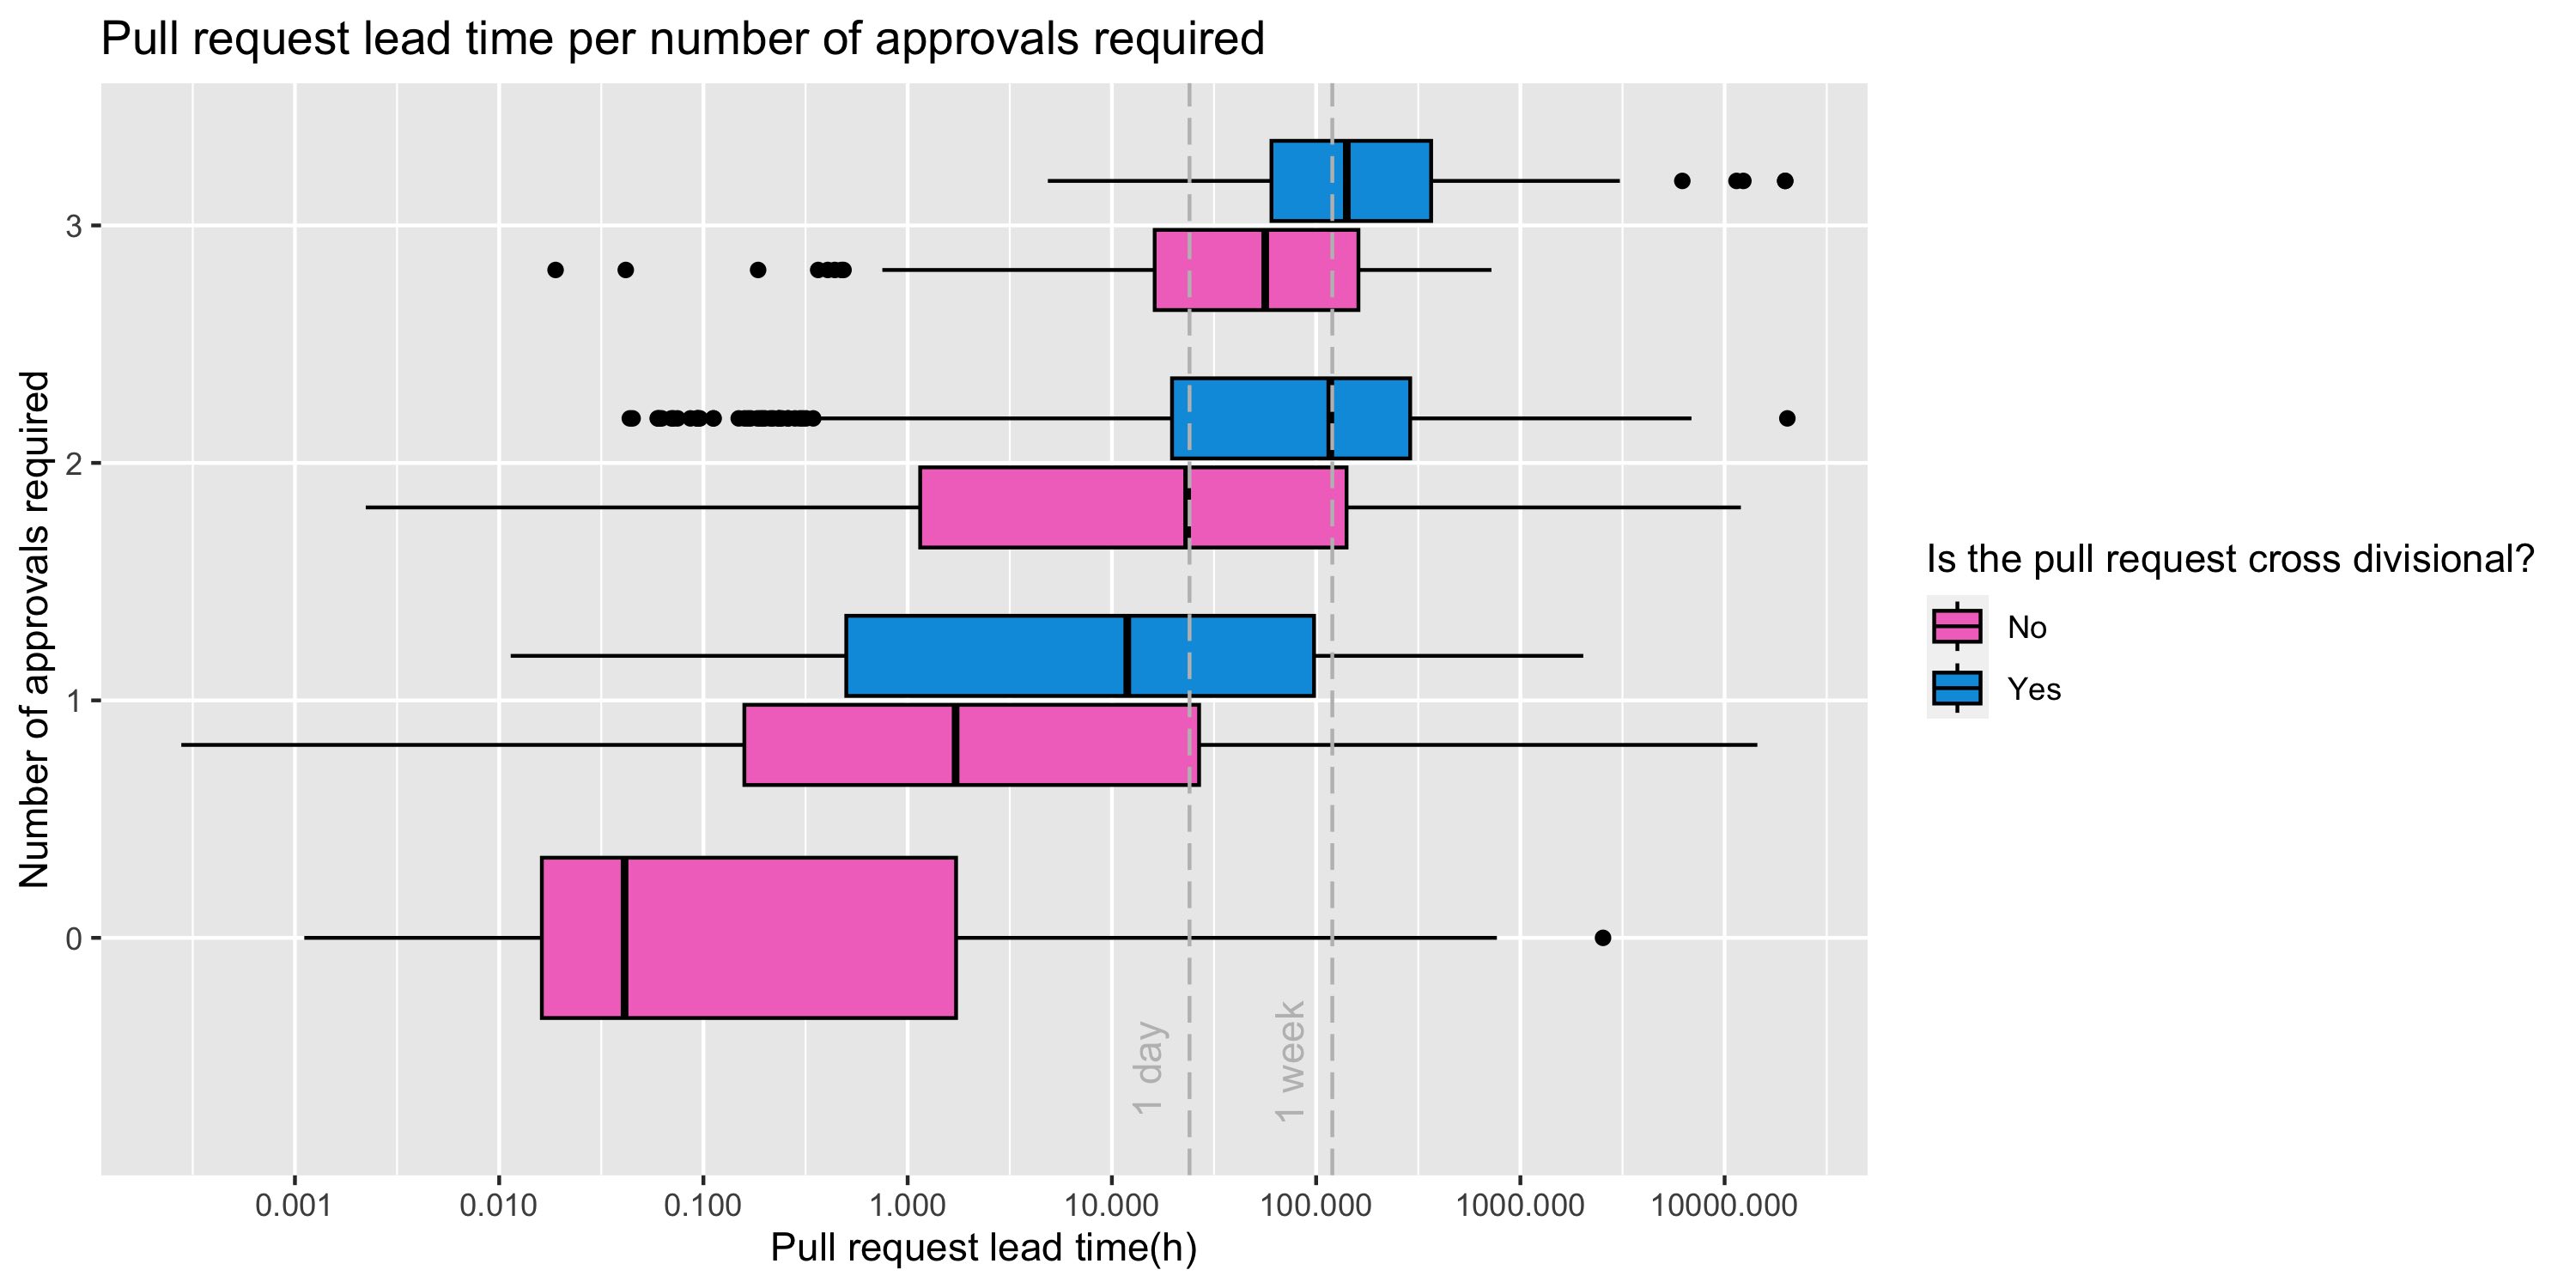
Let’s take a look at the relationship between cross-divisional/divisional pull request and lead time coloured by number of approvals required:
From this chart, we can see that as the number of approvals required increases, the pull request lead time also increases, independently of whether the pull request is cross-divisional or not. It is also interesting (and reassuring) to see that there are no cross-divisional pull requests that have 0 approvals required.
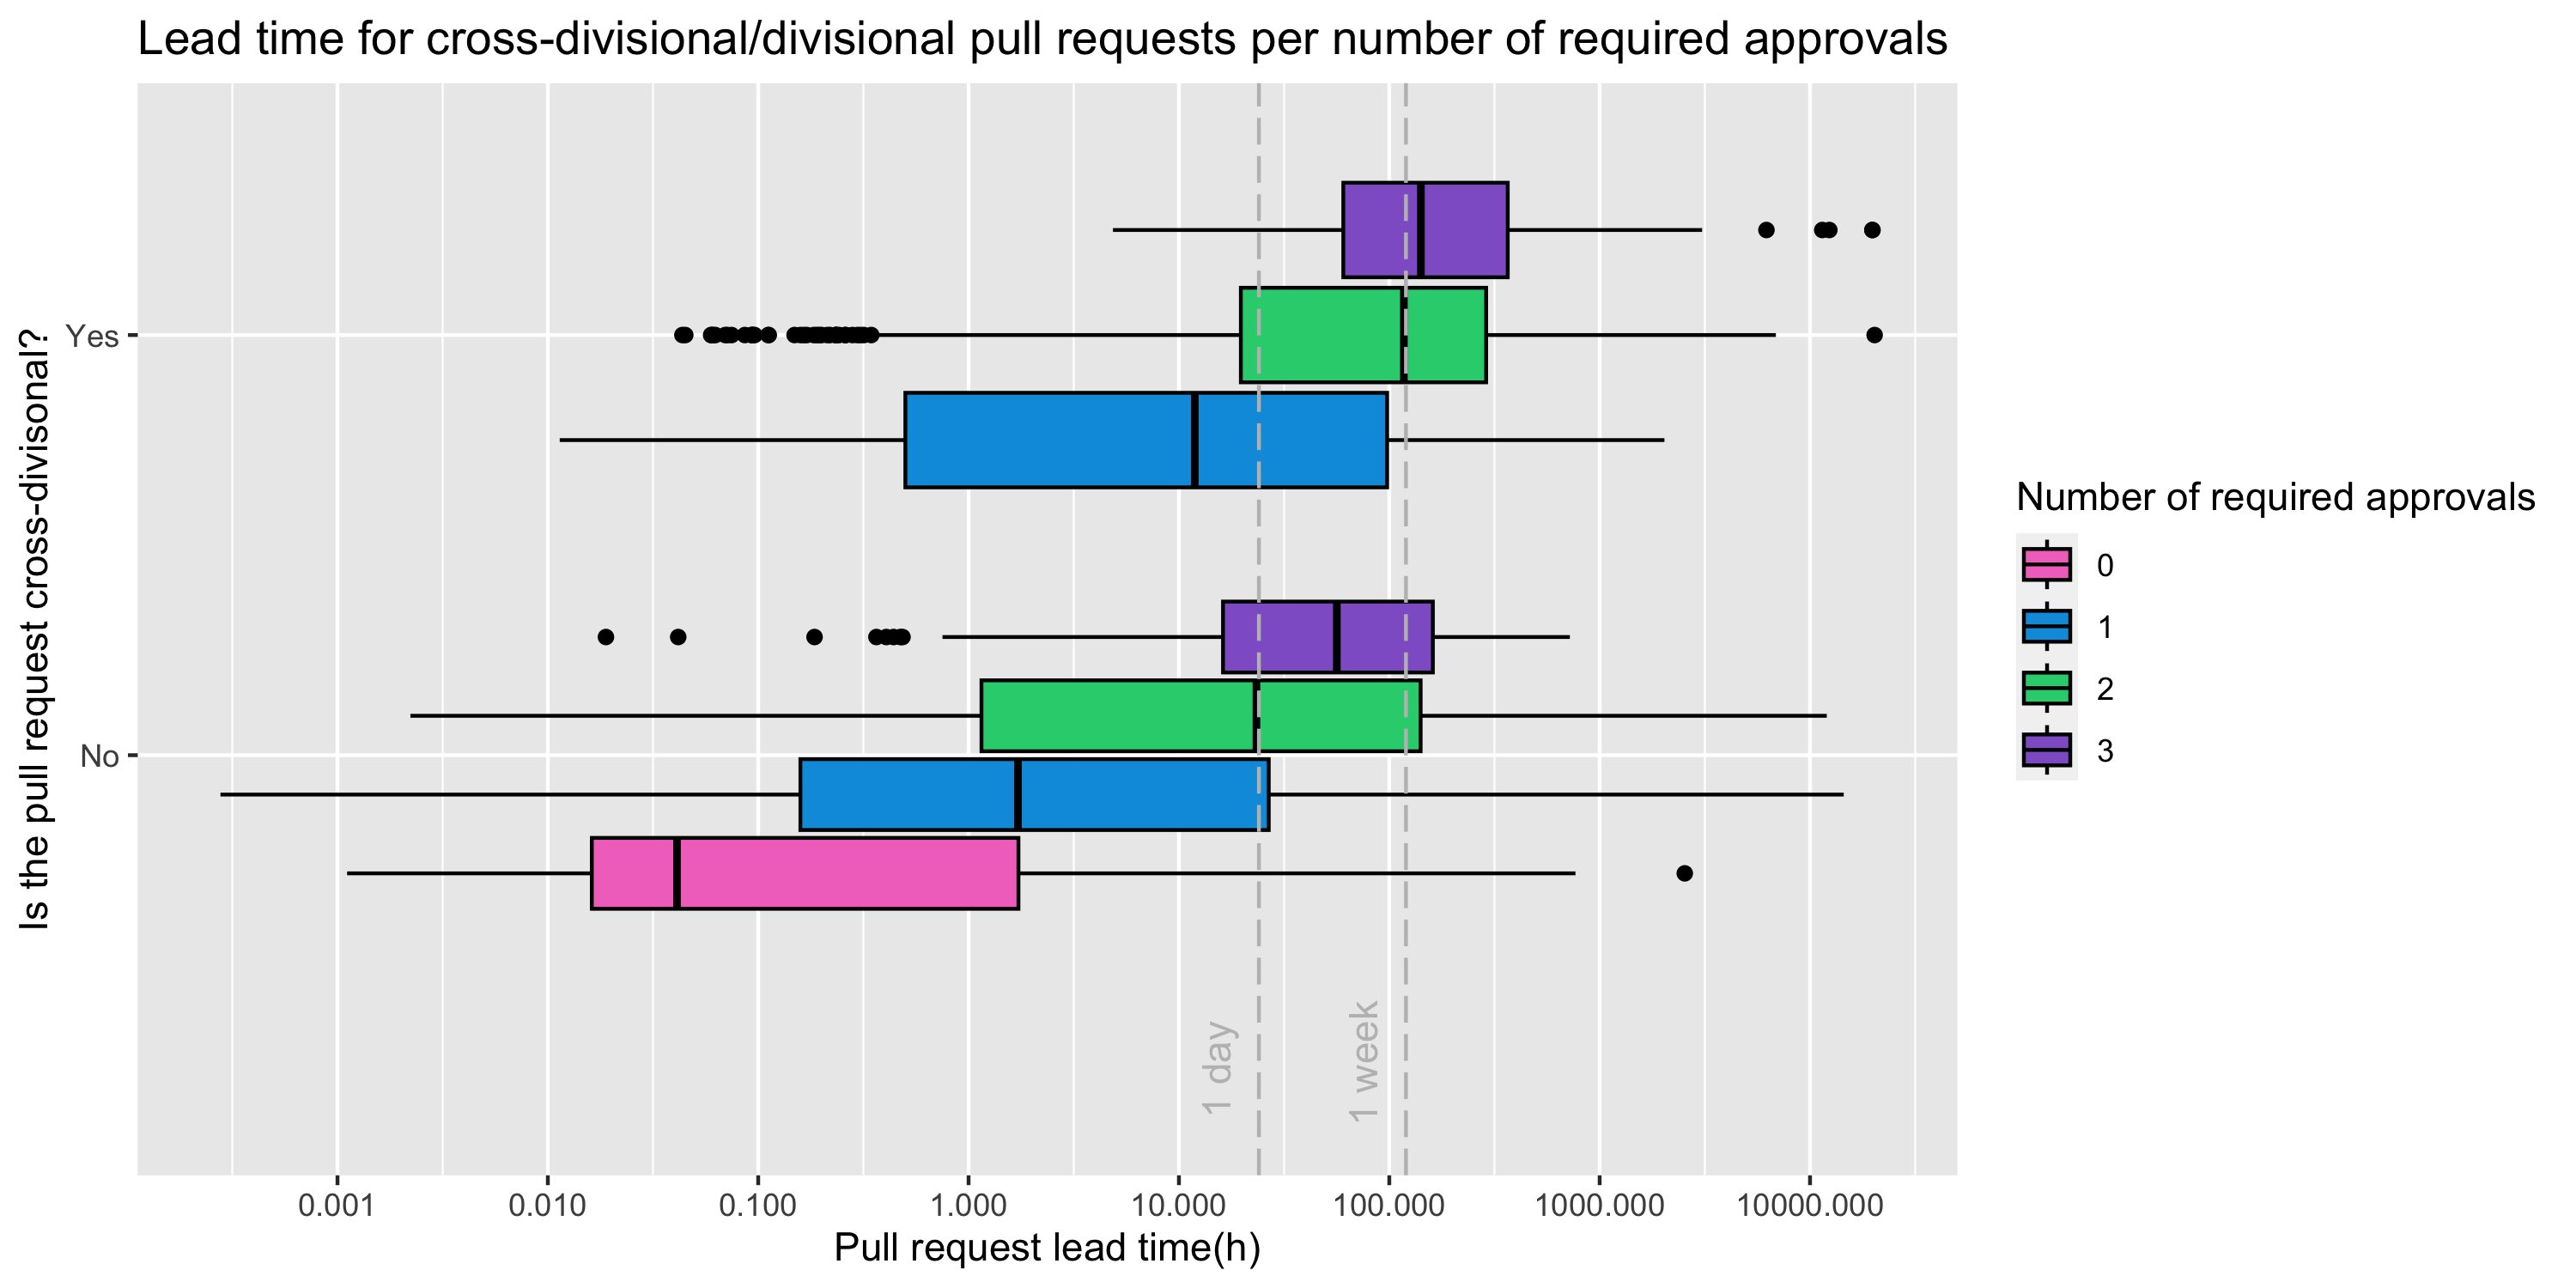
Let’s take a look at the relationship between number of approvals required and lead time coloured by whether a pull request is cross-divisional or divisional:
It is possible to see that being cross-divisional increases the pull request lead time, independently of the number of required approvals.
Conclusion
This blog post showed that:
- cross-divisional pull requests have longer lead times compared to their divisional counterparts
- as the number of approvals required increases, so does the pull request lead time. Choosing to go from 0 approvals required to 1 or more seems to lead to the most significant increase
- the total number of maintainers on its own does not seem to influence lead time. However, looking into divisional distribution inside the maintainer groups might lead to different results
- pull request size on its own does not seem to influence lead time. However, there are repositories with specific purposes, e.g. documentation, that might deter from any meaningful conclusions
- repository main language didn’t lead to any meaningful conclusions regarding pull request lead time. However, it raised the important question of whether configuration repositories have a more consistent performance compared to application repositories
by: Tiago Almeida
in:
tags: Pull Requests
category: Insight