Pull Request Health
What is “Healthy”?
Signs of health include:
- A low number of open pull requests. This is called “work in progress” (WIP). A high WIP causes problems for maintainers who don’t know which to prioritise. An increasing WIP indicates a lack of capacity to review and merge the pull requests resulting in a growing backlog.
- Pull requests are merged and closed in a short time. This is called pull request lead time. A long lead time can indicate pull requests that are too large or a lack of maintainer capacity to review them quickly.
- Pull requests are being merged regularly. This is called throughput. Few or no pull requests being merged indicates the repository content might be stale. In this case the WIP and lead time measures might be unreliable.
WIP Examples
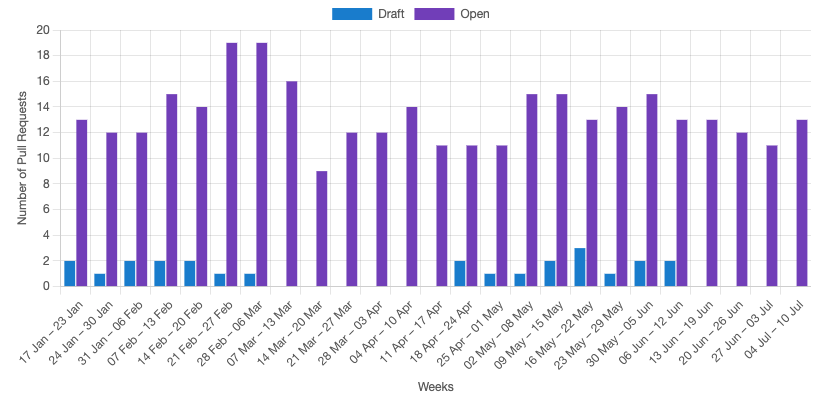
Work in progress (WIP) is the total number of pull requests open or in draft state. This is captured at the start of each week. For example the repository containing git-flutter CLI has a WIP of:
- There is a consistently low number of pending PRs which suggests healthy focus on a few changes at once.
- The throughput tab is a useful check on how busy the repo is over this period: in this case these WIP levels were maintained despite merging ~20 PRs/week during the busiest period in March.
- The draft counts show that the GitHub “Draft” feature is being used to get early automated feedback (e.g. lint/unit tests) and increase the visibility of upcoming review requests.
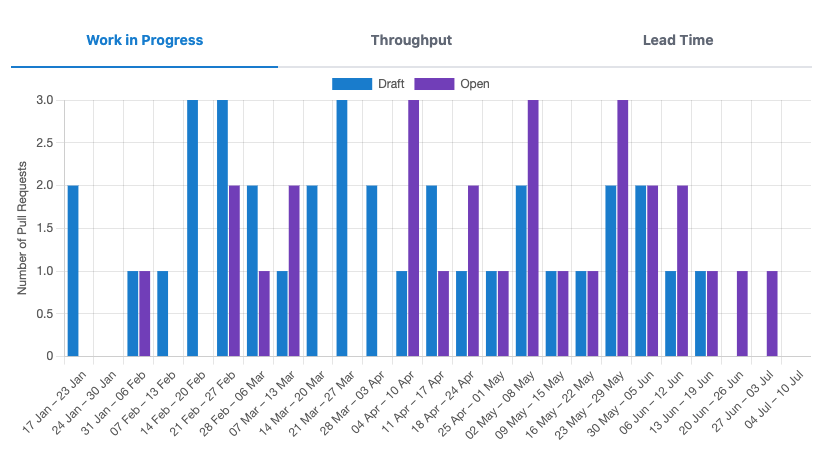
This is the WIP for a different repository:
- There are a larger number of pending PRs. This may indicate it can be hard for maintainers to know which PRs to prioritise reviewing first. Or this may be a result of a longer review time (e.g. multiple approvals required): the lead time shows this typical review time.
- The WIP has been consistent over the last 6 months showing that PRs are being actively managed in a sustainable way and not simply queuing up.
- Usage of draft PRs is limited in this repository, and their benefits may be worth exploring.
Lead Time Example
Lead Time is the number of hours between a PR being ready to review and merged or closed. It excludes Sat and Sun as these are expected to be non-working days. This provides an indication of how long pull request merge times are for an individual repository or a group of repositories.
For example the lead time across all repositories in the inner source automation capability is:
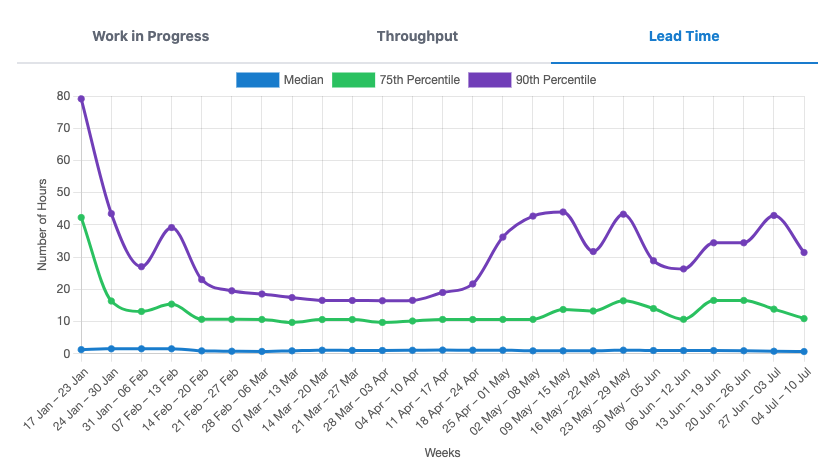
- The “usual” or median lead time is quick. The median of 1 hour means at least half of pull requests are approved and merged within 1 hour of being ready to review.
- The 75th and 90th percentiles provide an indication of how a slower (usually more complicated) pull request performs. A 90th percentile of ~48 hours means that 9 out of 10 pull requests are merged or closed within 2 days of being set to review.
- Changing patterns in lead time over time can be observed. A longer lead time in early January was due PRs waiting longer for approvers who were on holiday over christmas. Lower 75th/90th percentiles in March/April is due to a focused period working on CLI automation with a higher throughput and less variety of pull requests.
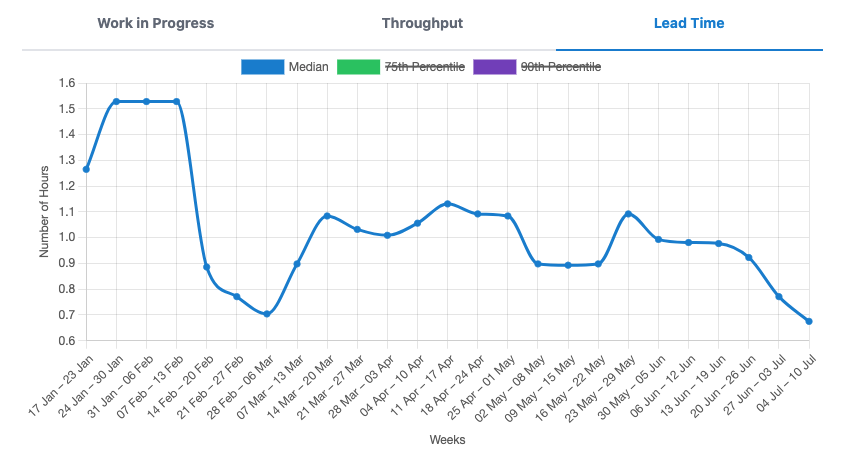
The 75th and 90th percentile lines can obscure the variance in the median. The visibility of any line can be toggled on/off by clicking on the legend box so the percentile lines can be removed as needed: